We’ve changed the way we collect and share demographic data!
As we launch a new and improved Demographics section of the Nonprofit Profiles on GuideStar, I’m having a very familiar feeling. In 2014, when GuideStar first launched the Demographics section, I was nervous and excited. We partnered with D5, a five-year coalition to advance philanthropy’s diversity, equity, and inclusion, to launch the Demographic data section. It was the first demographic data collection effort of its kind in the nonprofit sector.
I was nervous because that was the prevailing sentiment among nonprofits—nervousness. We were grappling not just with what it meant to collect staff and board demographic data, but what it meant to share it publicly. As a nonprofit ourselves, we were nervous that we’d get it wrong, or alienate people, or look bad in front of our peers (and not to mention funders).
I was excited because that was the sentiment of the sector, too. Many organizations recognized the potential of what could grow from a sector-wide focus on issues connected to diversity, equity, and inclusion, both in our workforce and in our programs.
Today, it’s nearly five years later. A lot of the nervousness has worn off for all of us, and I’m excited all over again!
More than 19,000 organizations have shared staff and board demographic data or organizational diversity practices via their Nonprofit Profiles. At the organizational level, the act of sharing data often causes staff to reflect on their respective organizations’ equity journeys. At the sector level, we’re learning more about where we are collectively in this journey.
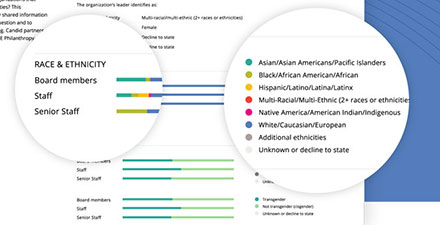
One way to describe where we are is to look at the type of data that organizations share. Considerably more organizations have shared information on gender identity and race and ethnicity. Far fewer are sharing sexual orientation and disability information. To me that says that this is our learning edge, that organizations likely need more support in collecting more sensitive demographic information.
We’ve shared aggregated data with funders and researchers to help them answer larger questions about the sector overall. One of our most public partnerships to date is with Green 2.0, an initiative dedicated to increasing racial diversity across mainstream environmental non-governmental organizations, foundations, and government agencies. Through the data shared in the Nonprofit Profiles, Green 2.0 tracks the progress of specific environmental organizations and holds them publicly accountable.
I’m excited because after nearly five years of learning from our partners and gathering feedback from nonprofits and funders, we’ve just launched a new and improved Demographics section. Candid partnered with CHANGE Philanthropy and Equity in the Center to revise the language and approach to collecting and sharing demographic information. Here’s what we changed:
- We added the ability to share leadership information. Over the years, many funders and researchers have requested demographic information specifically on organizations’ leaders and co-leaders. This addition is a great way to learn more about the people who lead organizations.
- We changed the language throughout. We first launched the Demographics section in 2014. Since then, the way the nonprofit sector talks about and understands identity and equity has evolved. We’ve updated our Demographics section to bring our language and approach up to date. In partnership with CHANGE Philanthropy, we’ve updated the language we use to describe demographic groups and added questions that better reflect the population.
- We swapped diversity strategies for equity strategies. Although diversity strategies are a helpful first step in an overall DEI journey, they are just a first step. Equity strategies take organizational practices a step further to build an organizational culture in which a person’s identities have no influence on how they fare within the organization. In partnership with Equity in the Center, we’ve adapted their Awake to Woke to Work framework for the Demographics section.
- We’ve made the interface easier to use. Our design and engineering teams refined the system by breaking the questions into more manageable chunks and offering lots of visual cues to better understand where you are in the process. See our step-by-step guide for completing the Demographics section for more information.
I’m excited, but I’m also practical. I know that more and better data for the sector will not solve all of our problems. But what it does do is allow us to take a mirror to the sector. As we better understand our challenges, we become better equipped to face them. This update comes six months into Candid’s existence, and echoes our broad commitment to contribute to important dialogue about racial equity.
Our efforts are of course part of a much bigger ecosystem of organizations grappling with issues of equity. For example, this improvement was funded by Borealis Philanthropy through the Racial Equity in Philanthropy Fund. I am inspired that we are among 19 organizations working in various ways to promote grantmaking strategies that prioritize structural change and ending racial disparities as the norm in philanthropy.
We invite you to share your organization’s demographic data. To get started, log into or claim your organization’s profile. And don’t forget the step-by-step guide for completing the Demographics section.
About the author

Related posts

Connecting the dots: Fighting for equity through a data partnership
Elizabeth Barajas-Román of WFN shares what a demographic data partnership with Candid enables for advancing equity in the sector, including the first-ever, public dashboard to analyze intersectionality in nonprofit executive leadership.
April 11, 2024

Candid’s DEI commitment, today, and for the future
Learn about Candid’s DEI journey, including how we got started and what we’ll do next to further strengthen our nonprofit’s culture of inclusion and belonging.
April 8, 2024

Doubling down on data for racial equity
Find out how demographic data collection via Candid profiles helps inform equitable grantmaking and reduce the reporting burden on nonprofits in this webinar recap.
April 4, 2024

Mitigating future risks: Why your organization should have an AI policy
Find out three reasons why having an AI policy can help maximize the benefits of new technology while minimizing the risks for organizations seeking to make a social impact.
April 1, 2024

Candid’s next generation platform
Get a glimpse into all that awaits in Candid’s next generation platform, powered by the most comprehensive data in the social sector, to streamline your mission-driven work.
March 20, 2024

Black leadership and Black experiences in the social sector
Revisit recent Candid research on Black leadership in the social sector, including a comprehensive analysis of private philanthropy’s support of HBCUs.
March 13, 2024